Talented and Gifted Equity Data Dashboard
TAG Equity Dashboard
Description
Percentage of students by race/ethnicity, gender, twice exceptional status, and English learner status identified for gifted and talented services compared to their targeted representation using the gifted equity formula.
The graphs on the TAG Equity Dashboard show how student groups are represented within the Talented and Gifted program compared to students in grades 2-12.
Dashboard Bar Graph Key
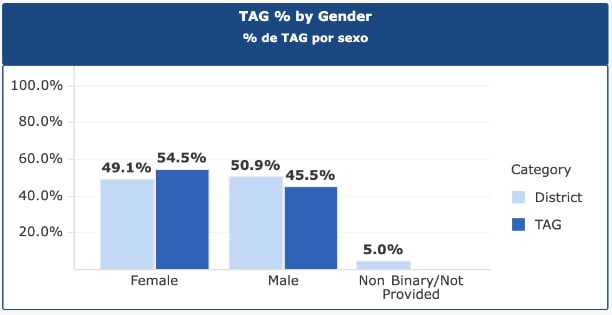
Light blue = District/School; Dark blue = District/School TAG enrollment.
Explanation of Equity Dashboard Graphs
The graphs on this dashboard show how student groups are represented within the Talented and Gifted program compared to students in grades 2-12. To use a specific example, here is how you would interpret the graph for female students:
- 54.5% of Talented and Gifted students were Female in the chart below.
- 49.1% of students eligible for the Talented and Gifted program were Female in the chart below.
Gifted Equity Formula
Enrollment targets for student groups in our Talented and Gifted program are set annually using the gifted equity formula (80% of district enrollment). Currently, our dashboard only displays a comparison to district enrollment as a whole. The yearly targets in the table below are based on the gifted equity formula. For additional information about the gifted equity formula - Wright, B., Ford, D., & Young, J. (2017) Ignorance or Indifference? Seeking Excellence and Equity for Under-Represented Students of Color in Gifted Education. Global Education Review, 4(1). 45-60. (https://eric.ed.gov/?id=EJ1137997).
Yearly Targets
|
CSI # |
Description |
SY23 |
SY24 |
SY25 |
SY26 |
|
44.1 |
Percentage of students by race/ethnicity, gender, twice exceptional status, and English learner status identified for gifted and talented services compared to their targeted representation using the gifted equity formula (HISPANIC AND/OR LATINO) |
29.9% NOT MET |
TBD |
TBD |
TBD |
|
44.2 |
Percentage of students by race/ethnicity, gender, twice exceptional status, and English learner status identified for gifted and talented services compared to their targeted representation using the gifted equity formula (FARMS) |
44.3% MET |
TBD |
TBD |
TBD |
Annual targets are determined based on enrollment rates of each student group using the gifted equity formula (80% of eligible students enrolled in the district).
Data Suppression Rules
The purpose of data suppression is to ensure the protection of personal data on individuals when releasing data in public reporting. We have taken the following steps to ensure that personally identifiable information cannot be discerned from publicly reported data on our CSI dashboards.
Suppression for Percentages
We suppress percentages that are less than 5% or greater than 95%. On our dashboards, these percentages will appear as 5% or 95% (their exact values will be hidden from public reporting).